
It is vital to benchmark your SEO KPIs to identify the areas for improvement and to get the best ROI from your SEO campaign.
Nowadays, most businesses are investing in SEO, and as a result, ranking fluctuations are more common.
Moreover, Google updates its algorithm almost nine times per day which is another major reason for organic ranking changes, directly impacting organic traffic and conversions.
So, unless you are making the right tweaks and adjustments to your SEO strategy and benchmarking the most essential SEO metrics, your competitors will win the race.
When you benchmark your primary keywords and other crucial site metrics, you are in a better position to take the next actions to further optimize your campaign.
In this article, we will discuss the importance of SEO benchmarking, learn how to do it in five easy steps, identify the most crucial SEO metrics that you should understand and compare, and discuss some of the top SEO tools that you can use to benchmark your SEO.
Let's start with the basics first.
What Is SEO Benchmarking?
SEO benchmarking is the process of comparing your website’s SEO metrics with the leading competitors in your industry.
When you begin your SEO campaign, you should benchmark some essential SEO metrics such as keyword rankings, domain authority, organic traffic, conversions, etc., to assess where your business website stands right now and where you wish to take it in the next six months or so.
Comparing your SEO campaign performance with the right SEO benchmarks helps you keep track of your SEO ROI.

Image source: Mike Khorev
Why is It Important to Benchmark Your SEO?
SEO benchmarking is a part of competitor analysis, KPI tracking, and ROI analysis.
You should use SEO benchmarking to measure your marketing productivity and performance.
SEO benchmarking helps you set campaign goals, track performance, analyze what works and what is counterproductive, and change or eliminate the negative.
Using SEO benchmarking, you can stay up-to-date with the latest trends and determine the best performance strategy to reach your campaign goals.
This practice keeps you geared towards increasing your SEO productivity and ROI.
Monitoring and measuring results enable you to find the missing opportunities to improve your SEO.
How to Benchmark Your SEO?
Below are the five easy steps to benchmark your SEO performance:
Determine Which Metrics to Benchmark
Every business has different goals.
The first step is to determine the goals to benchmark in your SEO campaign.
Based on your business priorities, you can set total organic traffic, total keywords in the top 10 rankings, total sign-ups on your site, total backlinks, bounce rate, dwell time, total goal completions, etc., as metrics for SEO success measurement.
To benchmark your SEO, you must be clear about your goal and determine the vital metrics that are essential for your business.
Do an Analysis of the Respective Metrics
Once you have determined the metrics to benchmark, the next step is doing an analysis of the selected metrics.
You can use a number of tools to perform your SEO benchmark analysis. The top 3 tools for SEO benchmarking are SEOptimer, Google Analytics, and Google Search Console.
Compare Technical Differences Between You and Your Competitors
Comparison gives you extensive insight.
If your website has technical drawbacks, it becomes difficult for your website to rank higher in the organic SERP.
Therefore, it is crucial to compare the technical differences between you and your top three competitors to determine the best SEO actions to improve your website performance.
Here are some of the technical SEO issues that you should measure and compare:
- The URL structure of your site vs. competitor sites. Shorter and easy-to-understand URLs work best.
- The site speed. You can use the SEOptimer website load speed performance tester to measure site speed. Faster loading sites offer the best user experience.
- Core web vitals score. Our SEO report tool lets you track the core web vitals score of your site vs. your competitor sites. Having a core web vitals score above 90 is what you should aim for.
- Content structure. You should compare the keywords that your competitors have used in their landing pages, the number of times they have used them, and the type of LSI variants they have added related to the seed keyword.
- Meta tags. You should compare the position and usage of primary keywords in the title, description, and H1 tags. Ideally, the title, meta description, and H1 tags should start with the primary keyword and should also have some secondary keywords.
- Backlinks. The number of links your competitors have vs. what your site has is crucial to determine your ideal link-building strategy.
Apart from these, they can be other factors such as HTTPS usage, duplicate content, word count, crawl errors, broken links, outbound links, mobile-friendliness, etc., that you should check and compare.
The more factors you compare, the better optimized your site would be, leading to higher rankings and traffic.
Determine Which Areas You Need to Improve On
Now that you have the SEO metrics and the technical SEO factors checklist, you should determine the SEO areas for improvement.
Mark the metrics where your site is lagging behind the competitors and create an SEO plan to improve them.
For example, if your competitor has links from 50 referring domains and your site has links from 30 referring domains, then you should aim to get around 10-15 links every month from new and relevant domains to defeat your competitors.
Determining the areas to improve on and devising a strategy to reach your goals is vital to SEO strategy success.
Regularly Monitor
Once you have completed all the above four steps, start monitoring and tracking your performance regularly.
For instance, you want to ensure that you track keyword rankings over time in order to determine if your SEO efforts are paying off.
Ensure that every step you take has an impact.
If your marketing technique works, analyze why and how it works. If any marketing technique fails to make an impact, find out the reason behind it.
Based on the results, tweak your SEO strategy accordingly to achieve your desired campaign goals.
SEO Metrics You Need to Understand Compare
Here are the top SEO metrics that you should understand and compare:
Organic Traffic
Organic traffic is one of the crucial benchmarks for any SEO campaign.
Determine your total organic traffic and your competitors' organic traffic. Compare the difference in traffic by preparing a list of keywords that are driving traffic to your competitor's site vs. your site.

Doing so will help you identify the exact keywords that you should target in your SEO campaign to defeat your closest competitors.
Landing Page Conversions
Note down the current landing page conversions before you begin the SEO work.
When you benchmark the target landing page conversions, you can easily identify the percentage of increase in conversions after your SEO campaign starts.
Landing page conversions are directly tied to SEO ROI so you shouldn't forget to benchmark them.
Backlinks
Backlinks are one of the vital factors for SEO.
A website that has the highest number of links from quality and relevant domains has the highest chances of ranking at the top in the search results.
Benchmark the number of links and the total referring domains pointing to your website.
You can also note down the trust flow and citation flow to show your SEO campaign progress in the future.
SEOptimer’s backlink checker can help you track these metrics.

Bounce Rate
Bounce rate is vital to understand whether people take action after they land on your website from the SERP.

The bounce rate is often associated with the average session duration. You must combine both to determine the result.
If the average session duration rate is lower, your site's bounce rate would be high.
But, if the average session duration rate is higher, your site's bounce rate would be lower.
Bounce rate analysis lets you identify whether your webpage content is engaging, has relevant keywords, and provides a good user experience.
Your SEO campaign should focus on lowering the bounce rate because a lower bounce rate indicates people are interested in your services and products, leading to more conversions.
Benchmarking the bounce rate before and after you begin your SEO work will show value to the clients that SEO work is providing.
Dwell Time
Dwell time is the length of the time a person spends on your website after they've clicked your website from the SERP result before they go back to the search results.
A higher dwell time indicates that the page is relevant to the visitors, and they consume most of the content on the page.
When you benchmark dwell time for your target landing pages, it offers you another vital metric to show the value of your SEO work to your clients.
SEO Benchmark Tools
Here are the top three SEO benchmark tools that will help to identify, compare, and measure your SEO metrics:
SEOptimer
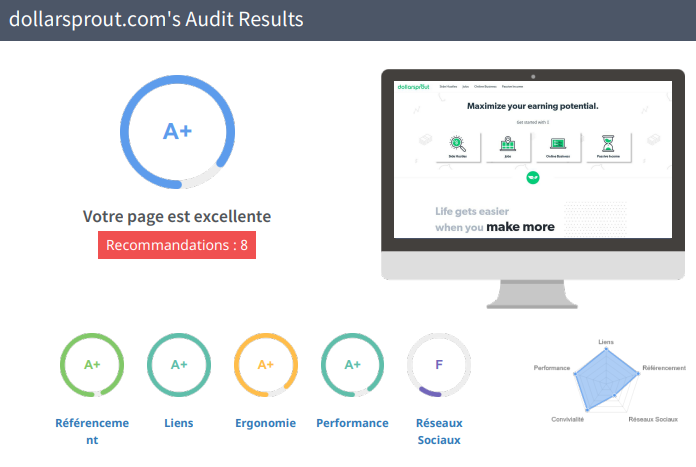
SEOptimer is an excellent SEO benchmark tool that lets you keep track of your SERP performance.

Our SEO tool will benchmark all essential site metrics such as the overall SEO score, links score, usability score, performance score, social score, etc., to measure the changes in performance.
Google Analytics
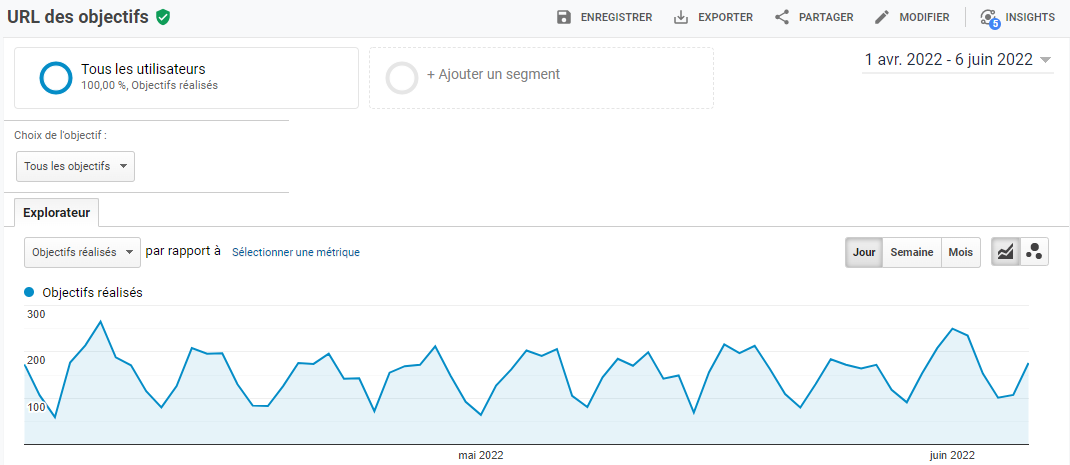
Google Analytics is a fantastic analytics tool that enables you to track and monitor your website's performance in real-time.

Plus, pairing Google Analytics and Google Search Console helps you efficiently manage your website's SEO in one place.
Google Analytics helps you determine the organic traffic, the dwell time, the bounce rate, and the landing page conversions.
Google Search Console
Search Console is another free tool by Google that tells you the number of backlinks pointing to your site.

It also tells the number of impressions and clicks that your web pages are generating from the search results.
Conclusion
SEO is one of the most effective marketing techniques to generate profits for your business in the long run.
Your website has to be perfect to outsmart your competition in every aspect.
Benchmarking your SEO helps you stay on the right trajectory towards your goal.
Follow the SEO benchmarking steps discussed in this article to successfully compare the vital SEO metrics and benchmark them to meet your marketing goals.


